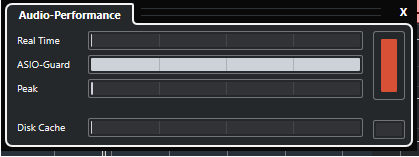
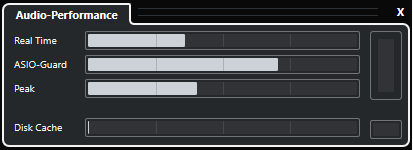
Das Tool mal laufen lassen und berichten:
LatencyMon: suitability checker for real-time audio and other tasks
www.resplendence.com
_________________________________________________________________________________________________________
CONCLUSION
_________________________________________________________________________________________________________
Your system appears to be suitable for handling real-time audio and other tasks without dropouts.
LatencyMon has been analyzing your system for 0:07:36 (h:mm:ss) on all processors.
_________________________________________________________________________________________________________
SYSTEM INFORMATION
_________________________________________________________________________________________________________
Computer name: DESKTOP-6A9KU4E
OS version: Windows 10, 10.0, version 2009, build: 19045 (x64)
Hardware: MS-7C52, Micro-Star International Co., Ltd.
BIOS: 3.50
CPU: AuthenticAMD AMD Ryzen 5 3600 6-Core Processor
Logical processors: 12
Processor groups: 1
Processor group size: 12
RAM: 16337 MB total
_________________________________________________________________________________________________________
CPU SPEED
_________________________________________________________________________________________________________
Reported CPU speed (WMI): 360 MHz
Reported CPU speed (registry): 360 MHz
Note: reported execution times may be calculated based on a fixed reported CPU speed. Disable variable speed settings like Intel Speed Step and AMD Cool N Quiet in the BIOS setup for more accurate results.
_________________________________________________________________________________________________________
MEASURED INTERRUPT TO USER PROCESS LATENCIES
_________________________________________________________________________________________________________
The interrupt to process latency reflects the measured interval that a usermode process needed to respond to a hardware request from the moment the interrupt service routine started execution. This includes the scheduling and execution of a DPC routine, the signaling of an event and the waking up of a usermode thread from an idle wait state in response to that event.
Highest measured interrupt to process latency (µs): 660,90
Average measured interrupt to process latency (µs): 4,702169
Highest measured interrupt to DPC latency (µs): 658,60
Average measured interrupt to DPC latency (µs): 1,650245
_________________________________________________________________________________________________________
REPORTED ISRs
_________________________________________________________________________________________________________
Interrupt service routines are routines installed by the OS and device drivers that execute in response to a hardware interrupt signal.
Highest ISR routine execution time (µs): 114,090
Driver with highest ISR routine execution time: dxgkrnl.sys - DirectX Graphics Kernel, Microsoft Corporation
Highest reported total ISR routine time (%): 0,034545
Driver with highest ISR total time: dxgkrnl.sys - DirectX Graphics Kernel, Microsoft Corporation
Total time spent in ISRs (%) 0,036889
ISR count (execution time <250 µs): 279465
ISR count (execution time 250-500 µs): 0
ISR count (execution time 500-1000 µs): 0
ISR count (execution time 1000-2000 µs): 0
ISR count (execution time 2000-4000 µs): 0
ISR count (execution time >=4000 µs): 0
_________________________________________________________________________________________________________
REPORTED DPCs
_________________________________________________________________________________________________________
DPC routines are part of the interrupt servicing dispatch mechanism and disable the possibility for a process to utilize the CPU while it is interrupted until the DPC has finished execution.
Highest DPC routine execution time (µs): 784,230
Driver with highest DPC routine execution time: nvlddmkm.sys - NVIDIA Windows Kernel Mode Driver, Version 531.41 , NVIDIA Corporation
Highest reported total DPC routine time (%): 0,046119
Driver with highest DPC total execution time: Wdf01000.sys - Kernelmodustreiber-Frameworklaufzeit, Microsoft Corporation
Total time spent in DPCs (%) 0,093609
DPC count (execution time <250 µs): 866291
DPC count (execution time 250-500 µs): 0
DPC count (execution time 500-10000 µs): 70
DPC count (execution time 1000-2000 µs): 0
DPC count (execution time 2000-4000 µs): 0
DPC count (execution time >=4000 µs): 0
_________________________________________________________________________________________________________
REPORTED HARD PAGEFAULTS
_________________________________________________________________________________________________________
Hard pagefaults are events that get triggered by making use of virtual memory that is not resident in RAM but backed by a memory mapped file on disk. The process of resolving the hard pagefault requires reading in the memory from disk while the process is interrupted and blocked from execution.
NOTE: some processes were hit by hard pagefaults. If these were programs producing audio, they are likely to interrupt the audio stream resulting in dropouts, clicks and pops. Check the Processes tab to see which programs were hit.
Process with highest pagefault count: cubase12.exe
Total number of hard pagefaults 184484
Hard pagefault count of hardest hit process: 99155
Number of processes hit: 76
_________________________________________________________________________________________________________
PER CPU DATA
_________________________________________________________________________________________________________
CPU 0 Interrupt cycle time (s): 11,078717
CPU 0 ISR highest execution time (µs): 114,090
CPU 0 ISR total execution time (s): 1,977443
CPU 0 ISR count: 214247
CPU 0 DPC highest execution time (µs): 784,230
CPU 0 DPC total execution time (s): 4,044668
CPU 0 DPC count: 455507
_________________________________________________________________________________________________________
CPU 1 Interrupt cycle time (s): 1,160287
CPU 1 ISR highest execution time (µs): 88,450
CPU 1 ISR total execution time (s): 0,014811
CPU 1 ISR count: 4690
CPU 1 DPC highest execution time (µs): 233,190
CPU 1 DPC total execution time (s): 0,143017
CPU 1 DPC count: 28905
_________________________________________________________________________________________________________
CPU 2 Interrupt cycle time (s): 1,359266
CPU 2 ISR highest execution time (µs): 0,0
CPU 2 ISR total execution time (s): 0,0
CPU 2 ISR count: 0
CPU 2 DPC highest execution time (µs): 104,230
CPU 2 DPC total execution time (s): 0,098468
CPU 2 DPC count: 41124
_________________________________________________________________________________________________________
CPU 3 Interrupt cycle time (s): 1,026189
CPU 3 ISR highest execution time (µs): 0,0
CPU 3 ISR total execution time (s): 0,0
CPU 3 ISR count: 0
CPU 3 DPC highest execution time (µs): 104,550
CPU 3 DPC total execution time (s): 0,022247
CPU 3 DPC count: 8466
_________________________________________________________________________________________________________
CPU 4 Interrupt cycle time (s): 1,128355
CPU 4 ISR highest execution time (µs): 0,0
CPU 4 ISR total execution time (s): 0,0
CPU 4 ISR count: 0
CPU 4 DPC highest execution time (µs): 67,470
CPU 4 DPC total execution time (s): 0,05140
CPU 4 DPC count: 18444
_________________________________________________________________________________________________________
CPU 5 Interrupt cycle time (s): 1,157473
CPU 5 ISR highest execution time (µs): 0,0
CPU 5 ISR total execution time (s): 0,0
CPU 5 ISR count: 0
CPU 5 DPC highest execution time (µs): 71,280
CPU 5 DPC total execution time (s): 0,037180
CPU 5 DPC count: 10588
_________________________________________________________________________________________________________
CPU 6 Interrupt cycle time (s): 4,268412
CPU 6 ISR highest execution time (µs): 0,0
CPU 6 ISR total execution time (s): 0,0
CPU 6 ISR count: 0
CPU 6 DPC highest execution time (µs): 85,040
CPU 6 DPC total execution time (s): 0,375096
CPU 6 DPC count: 147634
_________________________________________________________________________________________________________
CPU 7 Interrupt cycle time (s): 1,518803
CPU 7 ISR highest execution time (µs): 0,0
CPU 7 ISR total execution time (s): 0,0
CPU 7 ISR count: 0
CPU 7 DPC highest execution time (µs): 93,830
CPU 7 DPC total execution time (s): 0,185590
CPU 7 DPC count: 95779
_________________________________________________________________________________________________________
CPU 8 Interrupt cycle time (s): 1,223935
CPU 8 ISR highest execution time (µs): 7,60
CPU 8 ISR total execution time (s): 0,022436
CPU 8 ISR count: 52302
CPU 8 DPC highest execution time (µs): 42,140
CPU 8 DPC total execution time (s): 0,066048
CPU 8 DPC count: 27094
_________________________________________________________________________________________________________
CPU 9 Interrupt cycle time (s): 1,055344
CPU 9 ISR highest execution time (µs): 4,970
CPU 9 ISR total execution time (s): 0,000949
CPU 9 ISR count: 1648
CPU 9 DPC highest execution time (µs): 81,510
CPU 9 DPC total execution time (s): 0,016501
CPU 9 DPC count: 6334
_________________________________________________________________________________________________________
CPU 10 Interrupt cycle time (s): 1,240858
CPU 10 ISR highest execution time (µs): 12,730
CPU 10 ISR total execution time (s): 0,001768
CPU 10 ISR count: 2945
CPU 10 DPC highest execution time (µs): 102,660
CPU 10 DPC total execution time (s): 0,057458
CPU 10 DPC count: 19727
_________________________________________________________________________________________________________
CPU 11 Interrupt cycle time (s): 1,149826
CPU 11 ISR highest execution time (µs): 4,920
CPU 11 ISR total execution time (s): 0,002174
CPU 11 ISR count: 3633
CPU 11 DPC highest execution time (µs): 88,240
CPU 11 DPC total execution time (s): 0,027220
CPU 11 DPC count: 6759
_________________________________________________________________________________________________________
Ich hoffe, ich hab richtig gemessen. Hab Latency Mon gestartet und anschließend das betroffene Projekt geöffnet. Dann ein paar Minuten das Projekt inkl. der Dropouts laufen lassen.


